Predicting Nonvoters in the 2020 Presidential Election
Abstract
The goal of this project is to use survey data from before and after the 2020 election to predict two outcomes: 1) whether respondents would vote for Trump or Biden or 2) if they would not vote or vote for a third-party candidate. By looking more closely at the characteristics of non-voters and third-party voters, Democrats can gain insights into an often-overlooked potential voter base. Rather than trying to appeal to Republicans or Independents, it might be a better strategy to look at non-voters and third party voters. Although we saw record high voter turnout in the 2020 election, a third of eligible voters still did not vote. Additionally, although third-party candidates received less than 2% of total votes in the 2020 election, in certain battleground states those votes could potentially affect the outcome of future elections.
Design
The data set came from ANES’ 2020 time series study, which consists of 8,280 pre-election interviews and 7,449 post-election interviews of eligible voters in the U.S. The pre-election interviews were conducted from August 2020 through Election Day (November 3rd) and the post-election interviews were conducted shortly after the election through the end of December 2020. The raw data has 8,280 rows and thousands of columns representing the questions in the survey. Questions include demographic information, feelings about the direction of the country, views on various issues (e.g. crime, the environment, the economy, healthcare, immigration, LGBTQ rights), trust in government and media, and other topics. The surveys were conducted over the web, video and phone.
Data
After filtering out respondents who did not indicate their candidate choice (whether it was Biden, Trump, no vote, or other) because they did not complete the post-vote surveys (other than those who voted early), there were 7,496 rows. Furthermore, I selected 28 potential features to use in the model. Initial features included respondents’ sex, age, party identification, household income, race, religion, religiousness, emotions, trust in government, trust in society, support of welfare and social services, support of guaranteed job income, support of immigration, and others. After further feature engineering, feature selection and dropping missing values, the final dataset included 5,755 data points and 15 features.
Algorithms
Feature Engineering
- Assessing features’ usability based on how many survey respondents answered the question (as opposed to refusing to answer or answering “don’t know”) and the feature’s impact on model performance
- Reversed the scaling on some features so that higher values would indicate higher support of that issue and lower support would indicate higher opposition, leading to easier interpretability later on
- Averaged certain similar features together to reduce refused/”don’t know” answers
- Converted categorical features to binary dummy variables
- Attempted to impute missing values for some features, but found that imputation was very inaccurate and adversely affected model performance
Final features: age, household income, party identification, education level, negative emotions, health insurance support, immigration support, welfare/social services support, environment support, religiousness, trust in media, positive emotions, trust in government, race, and religion.
Model Evaluation and Selection
K-nearest neighbors, logistic regression, decision trees, and XGBoost were attempted, but I deciding on random forest as the model with the strongest performance and highest interpretability, using accuracy as the evaluation metric.
The data set was split into a training/validation set and a testing set using an 80/20 split. I used random oversampling on the training data to increase the proportion of the minority target class (non-voters and third party voters) from ~17% to ~30%, which more closely reflects the real-life proportion of non-voters.
After selecting random forest as the best model to use, I ran a function using cross-validation to find the ideal hyperparameters for the model. Finally, I adjusted the hyperparameters, then ran the random forest model on the test set. The random forest model (with random oversampling) produced an accuracy score of 0.87 on the test data.
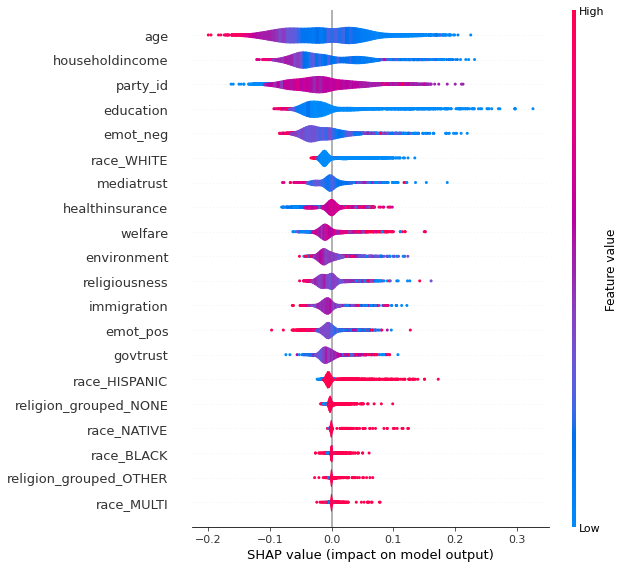
Additionally, the SHAP summary plot revealed which features had the highest impact on the model’s output.
Tools
- Numpy and Pandas for data cleaning and manipulation
- Scikit-learn for modeling
- Matplotlib and Seaborn for plotting
- Plotly for visualizations
Conclusions
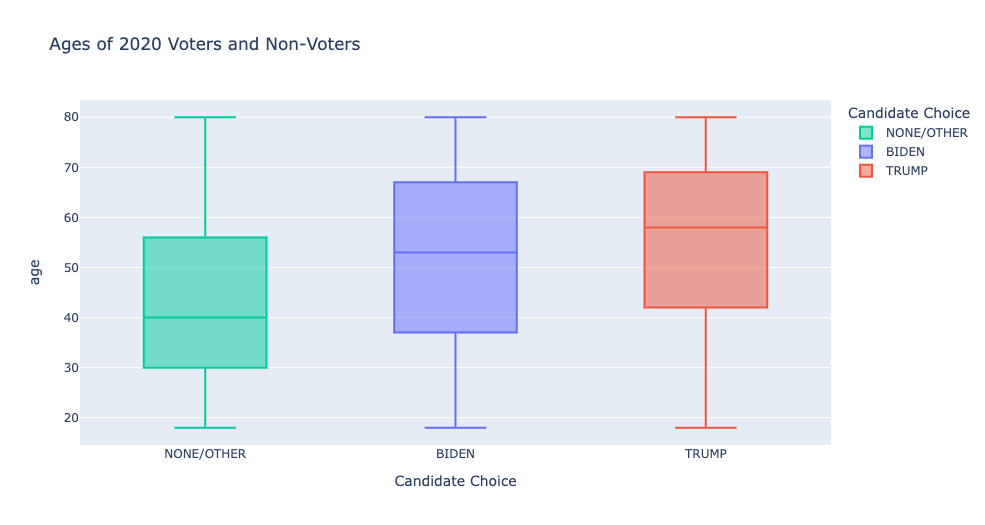
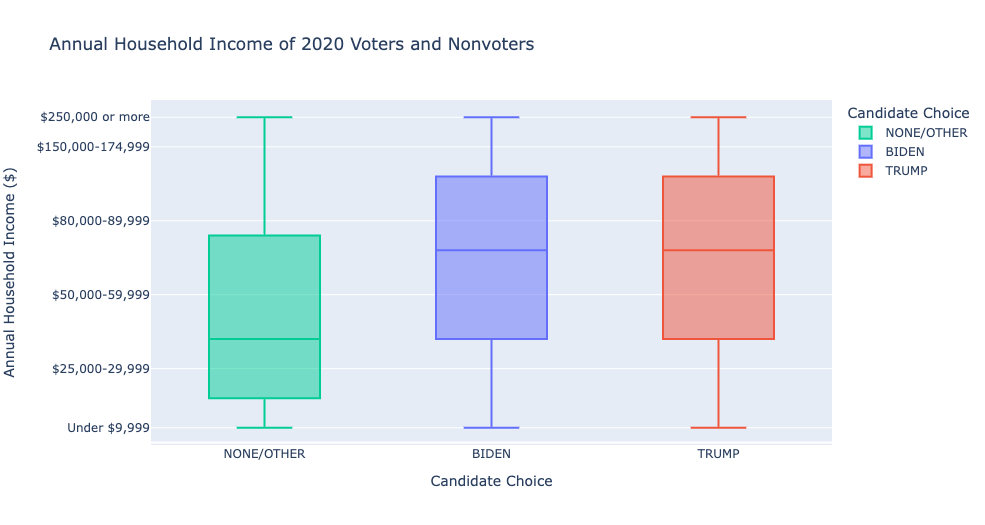
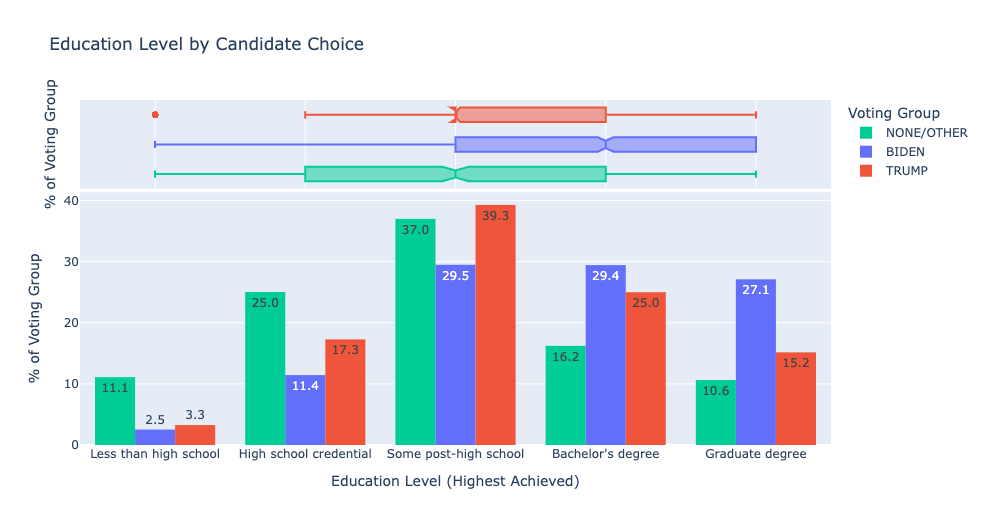
Nonvoters and third-party voters tend to be younger and have lower income levels and education levels.
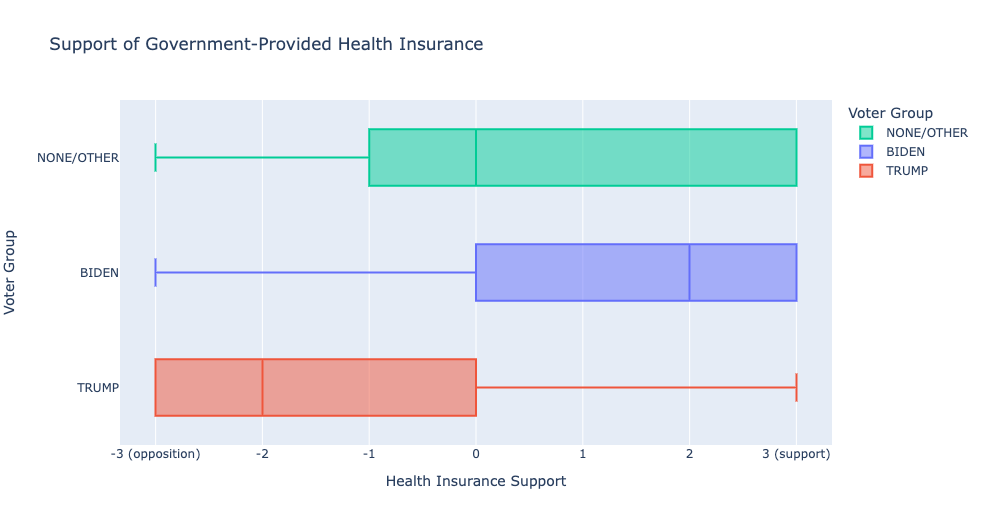
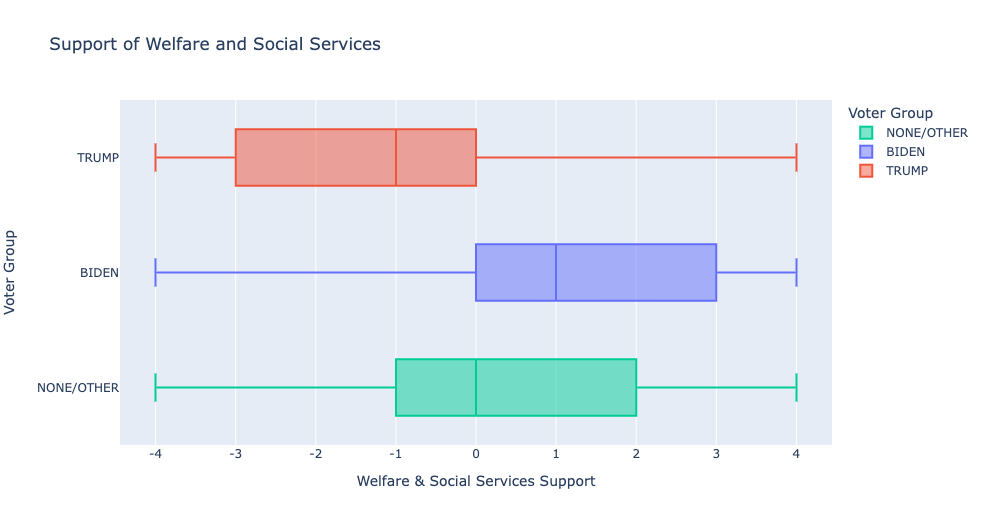
Nonvoters and third-party voters overlap with Democrats on certain issues, like health insurance and welfare and social services.
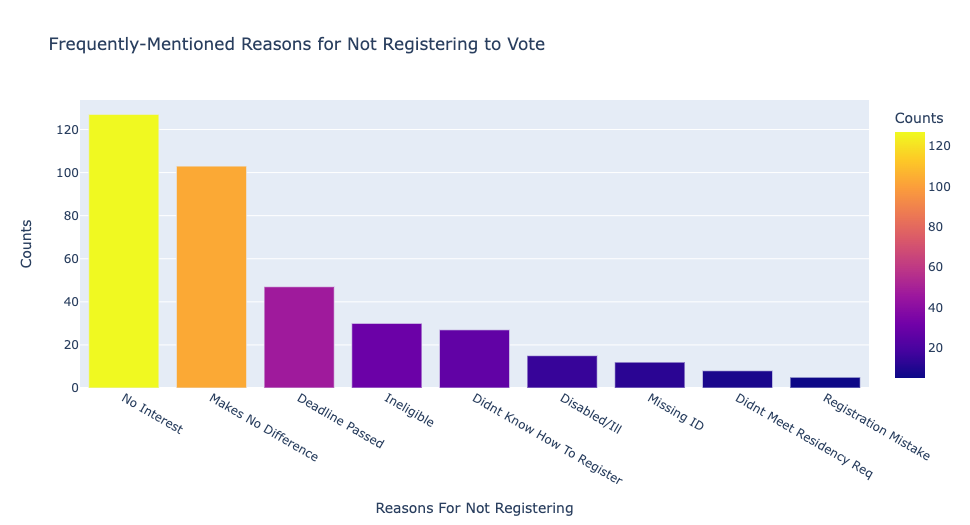
Nonvoters listed “no interest in the election” and “makes no difference” as their most frequently-mentioned reasons for not registering to vote.
For more info, see .pdf file of Google Slides presentation: https://github.com/amitian/ANES-2020-election