MTA Subway Ridership vs. NYPD Fare Evasion Arrests
Abstract
The goal of this project was to see if the number of fare evasion arrests was proportionate to the traffic at each subway station on the L line. One would expect the highest number of arrests to occur at stations with the highest traffic, but the results of this exploration might reveal a disparity between stations where fare evasion arrests are made and stations with the highest ridership. I also looked at other factors, such as race and household income, that might coincide with where arrests were made. This project is meant to be the beginning of an exploration into the larger question of equity in policing fare evasion. Learning more about fare evasion arrests would help increase public awareness of how anti-fare evasion laws are enforced in MTA subway stations.
Data
Data Sources:
- MTA turnstile data for ridership
- NYPD Arrests for fare evasion arrests (specified by law code ‘PL 1651503’)
- MTA Station Locations for latitude and longitude of stations
- Median Household Income by Census Tract
- Subway Station by Census Tract
Metrics
- Decided to focus on a single line (the L line) because it has relatively few stations. Also I focused on data from September through December of 2019 because I expected that there would be more arrests and ridership pre-COVID and wanted more data to work with.
- Used MTA Analysis Exercises to find the total entries at L train stations from September to December of 2019.
- Since the NYPD data does not include at which subway stations the arrests occurred, I used Python to cross-reference the latitude and longitude of arrests and the latitude and longitude of L train stations. I assigned station names to arrests that occurred within roughly a half mile of a station.
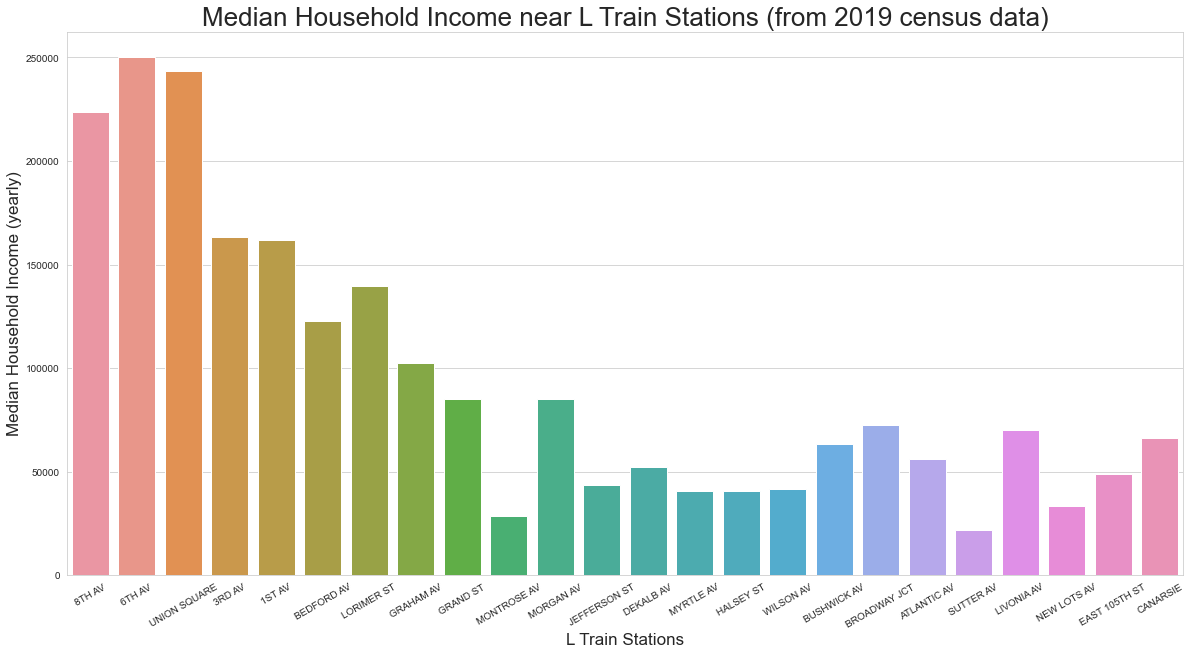
- I used census data (from the 2019 American Community Survey) to find the median household income for the census tract that each subway station was located in. (To find the census tract that each subway tract was located in, I referred to another graph created by Larry Buchanan based on data from NYC OpenData and the census.)
Tools
- SQL for initial exploration and querying to pre-filter data
- Python for data cleaning and further analysis
- Matplotlib and Seaborn for visualizations
Results
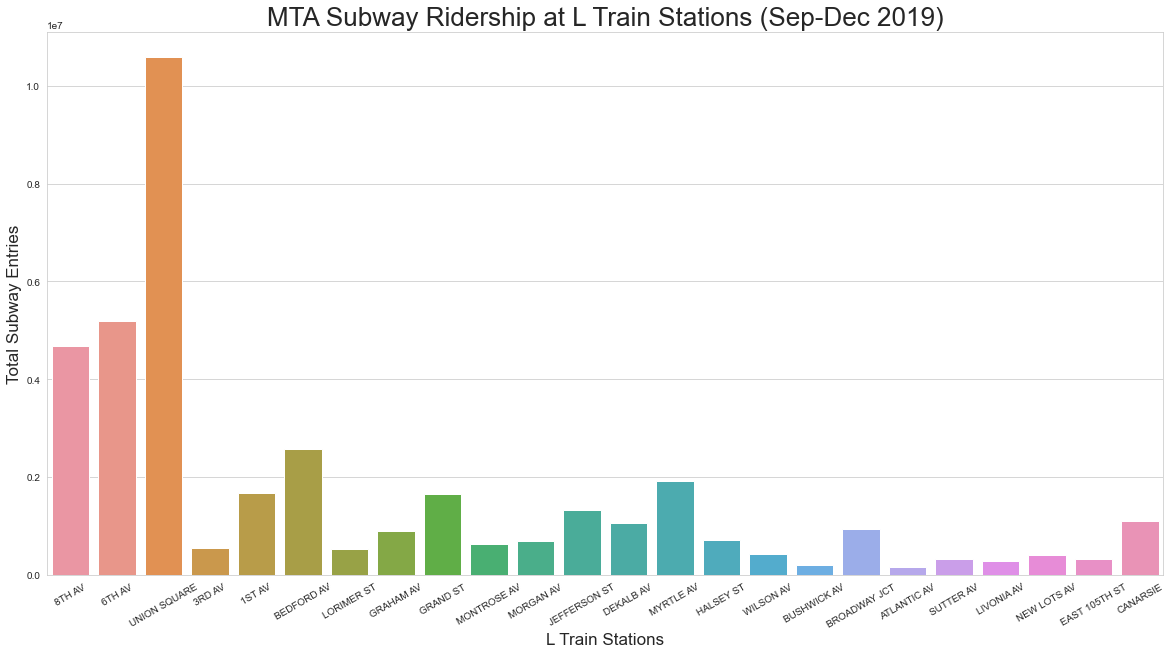
Union Square had the highest traffic, followed by the 6th Ave and 8th Ave stations.
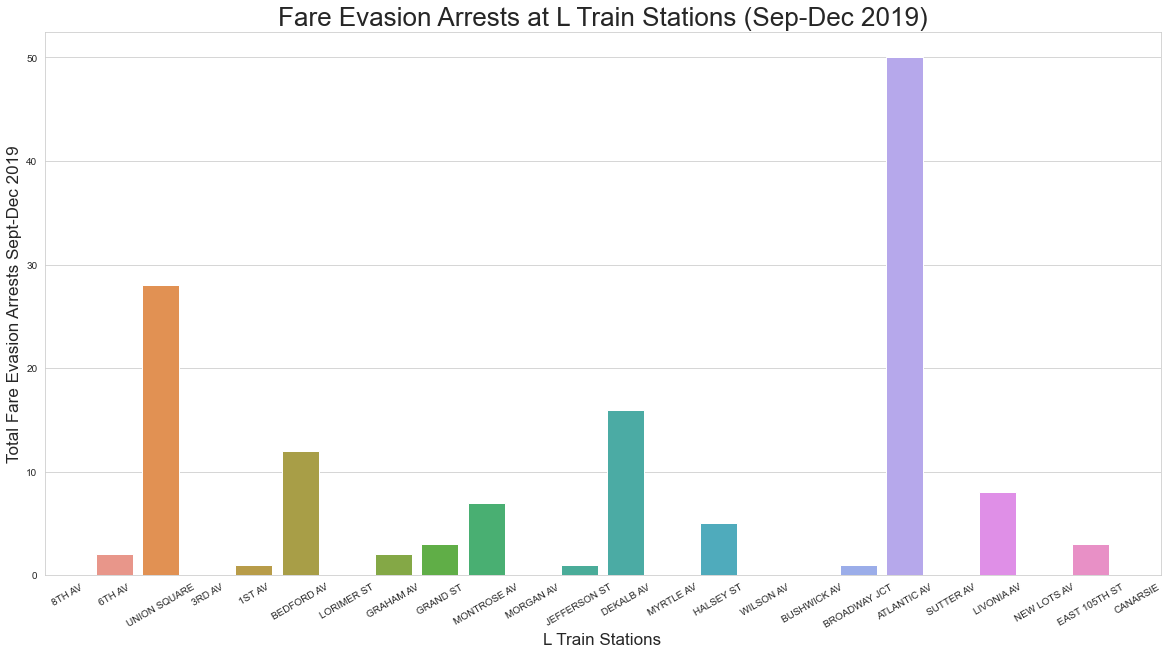
Atlantic Ave in East New York (not to be confused with the Atlantic-Barclays station in downtown Brooklyn!), which has relatively low traffic, had the most fare evasion arrests.
L stations in Brooklyn are located in areas with relatively lower median household incomes.
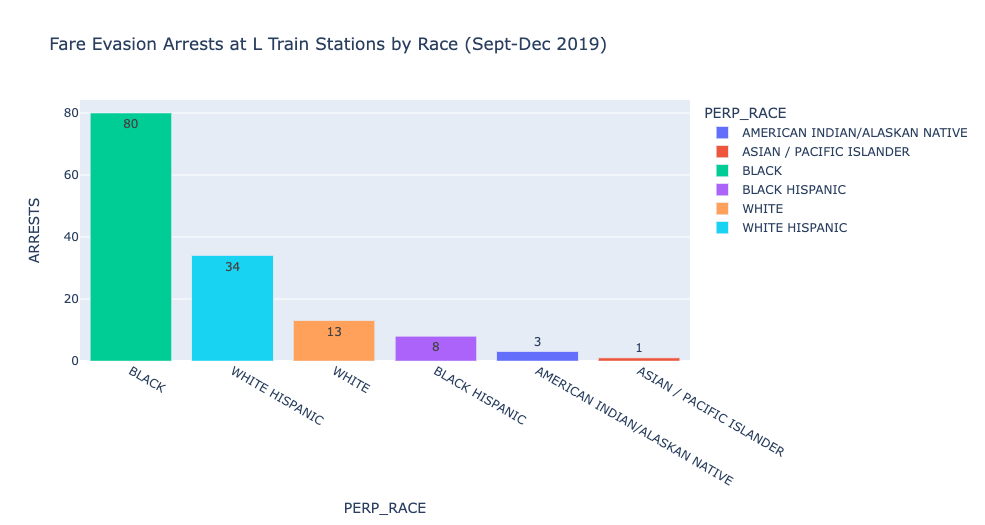
Aggregating fare evasion arrest data by race shows a disproportionate number of those arrested were Black, Hispanic or American Indian/Alaskan Native.
See .pdf of Google Slides presentation on GitHub: https://github.com/amitian/NYPD-fare-evasion-arrests
See interactive dashboard and more graphs on Tableau: https://public.tableau.com/app/profile/amitian#!/